How To Create A Project Network Diagram
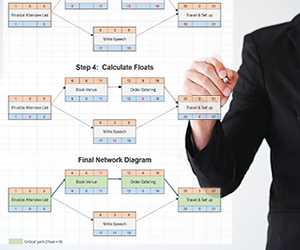
In project management, the network diagram is a graphical depiction of a project schedule which uses boxes to represent each task. It is used to determine the critical path, as well as the float of each task.
Critical Path: The tasks which define the completion date of the project. They cannot finish late, or be moved, or the overall project completion date will change by the same amount.
Float: The amount that a task can move without affecting the completion date of the project. Critical path tasks have a float of zero. Also called Slack .
Tasks
Prior to the construction of the network diagram, the project needs to have been broken down into its constituent tasks. Tasks should not be too small, or they become prone to micromanagement, or too large, hence they lose the benefit of project control (a large task is no different than a whole project).
A simple task list for a small convention I recently organized was:
- Finalize Attendees
- Book Venue
- Order Catering
- Write Speech
- Travel & Set up
Interestingly, several of these tasks can be done in parallel. If I forced myself to perform each task one after the other, I might be taking too long. That's where task dependencies come in.
Dependencies
Prior to the network diagram, the project manager must have determined the dependencies of each task. In theory, every task must be dependent on at least one other (except the first task) else it would not be part of the project. Hence, if you are in a project management class make sure they are all dependent upon one another.
There are four types of dependencies:
- Finish to Start (FS): Task B cannot start until Task A completes. This is the most common.
- Finish to Finish (FF): Task B cannot finish until Task A completes.
- Start to Start (SS): Task B cannot start until Task A starts.
- Start to Finish (SF): Task B cannot start until Task A start (this one is rare).
Also, the tasks do not have to line up exactly. A lead time means that Task B doesn't start until a period of time has elapsed, and a lag time means that Task B starts before Task A finishes. In project management software, there is usually only a lag time specified, and a lead time is simply entered as negative lag.
It sounds complicated, but suffice it to say that Finish to Start (FS) relationships are by far the most common and if you stick to those, you won't get into much trouble.
Creating the Network Diagram
A task box is usually drawn with six boxes. The duration and float are in the middle, and the four task dates are in the corners, like this:
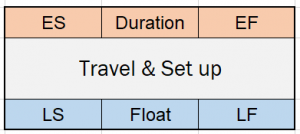
The four corners are defined as follows:
- Early Start (ES): The earliest possible date that the task will be able to start.
- Early Finish (EF): The earliest possible date that the task will be able to finish.
- Late Start (LS): The latest possible date that the task will be able to start without affecting the overall project completion date.
- Late Finish (LF): The latest possible date that the task will be able to finish without affecting the overall project completion date.
The Duration box is known prior to drawing the network diagram. It is an input. The four corners will be calculated, starting with the ES and EF via a forward pass, then the LF and LS via a backward pass. Finally, the float is calculated, which is an output of the network diagram.
The procedure for drawing the network diagram is as follows:
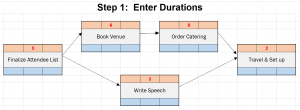
Step 1: Enter Durations
The task durations (in days) are entered into the top, middle box.
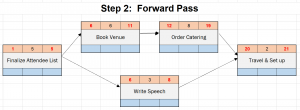
Step 2: Perform Forward Pass
Perform a Forward Pass to determine the Early Start (ES) and Early Finish (EF) dates. This is done using the following procedure.
- Enter ES = 1 for the first task (it starts on day 1)
- Determine the EF for the first task. Note that you have to subtract one because the Start and Finish dates are inclusive of the number of days.
EF = ES + Duration – 1
- Determine the ES for the next task by adding 1. When you have two (or more) LS dates to choose from, choose the higher one.
ES2 = EF1 + 1
- Repeat steps 2 and 3 for all the tasks in the network.
After the forward pass, our network diagram example looks like this:
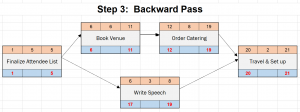
Step 3: Perform Backward Pass
Perform a Backward Pass to determine the Late Finish (LF) and Late Start (LS) dates.
- Enter LF = ES for the final project task (bottom right corner = top right corner). This is the project completion date, from which the backward pass starts.
- Determine the EF for the last task by subtracting the duration.
EF = LF – Duration + 1
- Determine the LF of the previous task by subtracting 1 from the EF of the later task. When you have two (or more) EF dates to choose from, choose the lower one.
EF1 = LF2 – 1
- Repeat steps 2 and 3 for all the tasks in the network.
After the backward pass, our network diagram example looks like this:
Step 4: Calculate Floats
This is a very simple calculation which tells you one of the most important values in project management.
Float = EF – ES
Float = Bottom right corner – Bottom left corner
Our network diagram example now look like this:
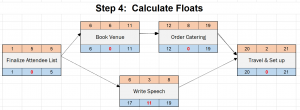
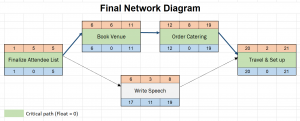
Tasks that have zero float are on the critical path. Often the critical path is highlighted to allow the project manager to more actively manage those tasks. Tasks that have very little float can very quickly affect the project completion date when things change, so they could also be actively managed.
A little bit of cleanup and our final network diagram is very exciting! Well, in a project manager sort of way.
Gantt Charts
Network diagrams are calculation tools that are meant to determine the critical path and floats. But the truly great tool in the project manager's toolkit is called a Gantt chart. These are charts that show the durations of each task in horizontal bar format. They are far more intuitive and communicate the schedule better.

Gantt charts are the more day-to-day administrative tool in the tool box. But they don't show you the critical path. Hence, the network diagram calculates the critical path behind the scenes and gives the project manager the knowledge they need to ensure the project finishes on time and budget.
You can draw the gantt chart without doing a network diagram, and many people do (I have as well). But if you want to build the most efficient schedule and know what items to focus on during the project, you need to know the critical path tasks.
Also, project management is difficult without knowing the floats – There are many situations where something unexpected arises and you wish to push a task past its completion date. The gantt chart won't tell you how much room you have to move.
Project Management Software
Today, the above procedure is largely an academic exercise limited to project management schools, because project management software calculates everything for you once you enter the task durations and dependencies. But as with most things, it's important to understand the underlying fundamentals in order to master the techniques in practice.
Resources
The major thing that is missing in the project scheduling procedure is resources.
If you need a piece of equipment, tool, laborer, building permit, or some other resource that doesn't (or can't) arrive in time, the whole scheduling exercise is meaningless. You will have to adjust the schedule to accommodate the resources mid-project, which results in project changes the client, customer, or owner doesn't usually enjoy.
Hence, in practice you will need to perform the scheduling with software while being keenly aware of task resources.
How To Create A Project Network Diagram
Source: https://www.projectengineer.net/how-to-draw-a-network-diagram/
Posted by: gordonopoetinat1997.blogspot.com

0 Response to "How To Create A Project Network Diagram"
Post a Comment